

The Dynasty Investor: An Intro to Technical Analysis (Charting)
Jay Stein applies investment and valuation concepts to Fantasy Football.

In past editions of The Dynasty Investor, we've approached Dynasty fantasy football through the lens of value investing—focusing on player fundamentals, production, and market inefficiencies. Although value is significant, timing is also essential. In this issue, we're introducing the concept of technical analysis—charting player prices over time to better understand momentum, trend reversals, and volatility. Just like in the stock market, player prices follow patterns, and by recognizing those patterns early, you can position yourself ahead of the market. Whether it's buying low before a breakout or selling high before a decline, technical analysis helps us read the signals that price history leaves behind.
At the core of technical analysis are a few foundational beliefs. First, price discounts everything. Price reflects all available information—whether it's a player's injury risk, depth chart position, or future upside, the market has already priced in the consensus view. Second, although history doesn't exactly repeat itself, it does tend to rhyme. Market behavior is cyclical. Just as we see familiar boom-and-bust patterns in the stock market, fantasy football players often follow predictable arcs: rookie breakouts, second-year leaps, or veteran fades. And third, trends persist until they don't. Trends tend to continue until a clear signal tells us otherwise. If a player's value is climbing, chances are it will continue to climb—until something disrupts the pattern. Recognizing these recurring cycles and momentum trends is how we time moves, not just make them.
Why It Matters: While value investing gives us a foundation for identifying underpriced players, technical analysis adds another layer—helping us time the market more effectively. Understanding how player values fluctuate can give you an edge in trades, startup drafts, and even waiver decisions. The goal isn't to predict the future but to react more rationally to what the market is already telling us.
Technical Analysis Concepts Applied to Fantasy Football
Reversion to the Mean: Over time, most player prices tend to gravitate back toward a long-term average. Just like a stock that's temporarily overbought or oversold, a player may become inflated due to recent performance or hype. Understanding a player's historical price range helps you recognize when the market has overcorrected. If a player's KeepTradeCut (KTC) price deviates too far from its baseline, it may signal a potential buy-low or sell-high opportunity.
Moving Averages: A moving average smooths out short-term volatility, making it easier to visualize long-term trends. In fantasy terms, tracking a player's rolling 150-day KTC average can show whether their market price is building sustained momentum or simply reacting to noise. When a player's price crosses above their long-term average (a bullish crossover), it may suggest a rising trend. The opposite is true for bearish crossovers.
Standard Deviations & Volatility: Standard deviation measures how far a player's price swings from their mean. High volatility can be risky, but it can also be profitable if timed right. Players with high deviation from their average price may present arbitrage opportunities—either as quick flips or contrarian long-term bets. Recognizing how far a player has strayed from their historical range can help determine whether to fade the crowd or follow the trend.
Trend Reversals: Bullish-to-Bearish and Bearish-to-Bullish: Just like in financial markets, player sentiment can shift rapidly. A bullish-to-bearish reversal might show up as a sharp drop in KTC following an injury, a trade, or poor performance. Bearish-to-bullish reversals may occur when a depth chart opens up or positive news hits. By identifying reversal patterns early—especially when the fundamentals haven't changed—you can anticipate moves that the rest of the market hasn't yet priced in.
Support and Resistance Levels: These are price levels where player value tends to bounce (support) or stall (resistance). In Dynasty, this could refer to a player who consistently holds value within a specific KTC range despite changing conditions. Watching how a player behaves near these levels can help you gauge whether the market is about to shift sentiment—or if it's more of the same.
Technical Analysis Example
Now, let's look at some charts. If you've been a reader of the Dynasty Investor in the past, you've seen this chart before, but let's take a look at what's all in there. Here is CJ Stroud's KTC chart to get us started:
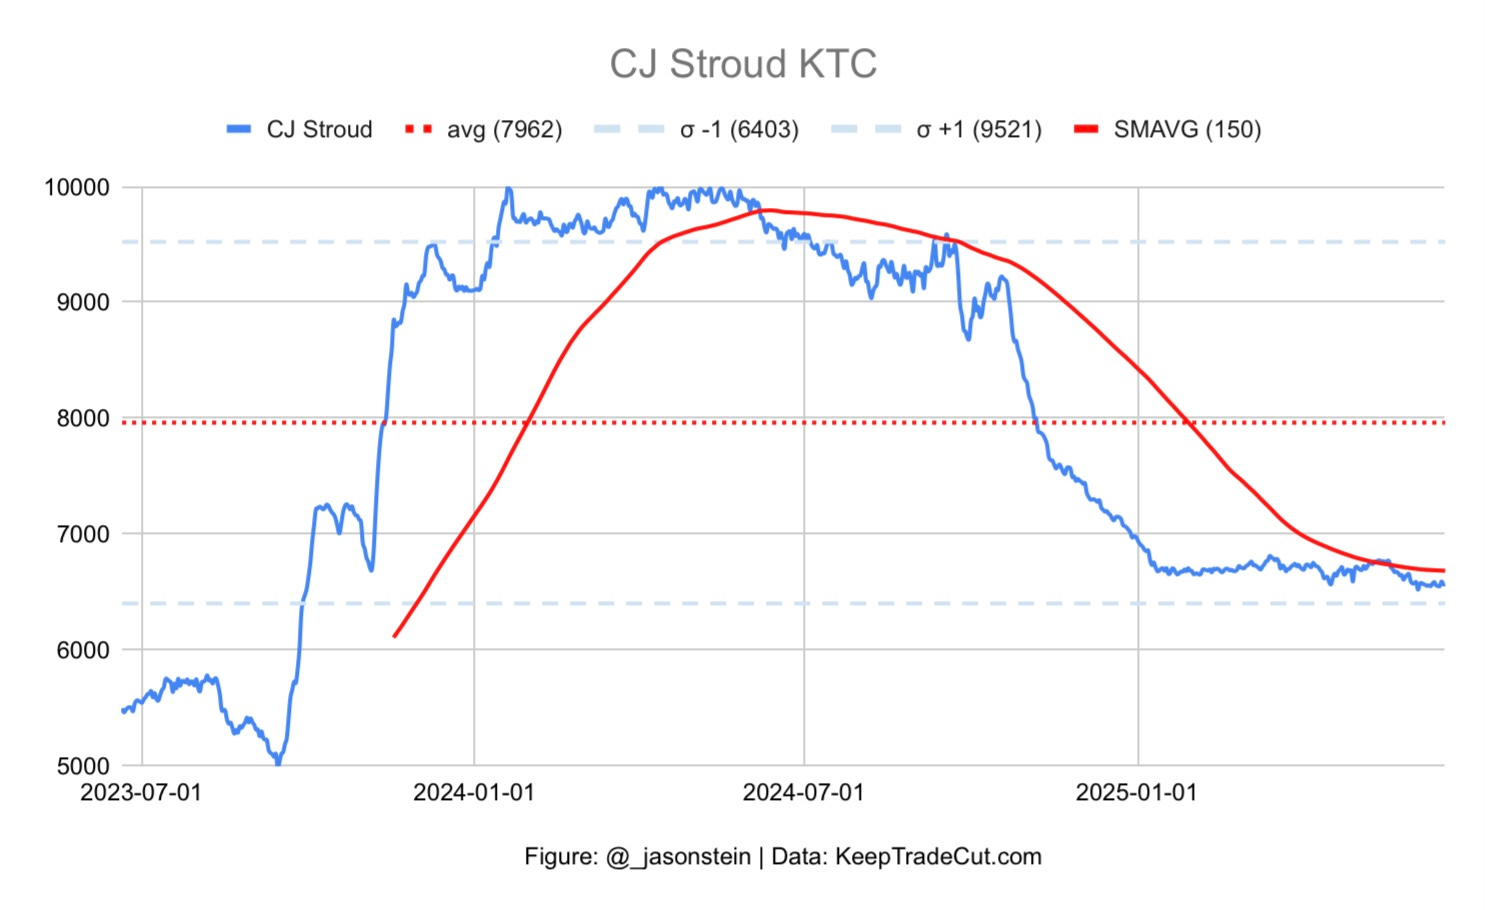
The blue line is Stroud's KTC over time, and the red dashed line down the center is his average KTC over this time horizon (2 years). In the legend at the top, you can see Stroud's average KTC over two years has been ~8000 KTC. The blue dashed lines are +/- one standard deviation of the series, where nearly 70% of the observations should fall w/in those blue dashed lines (again labeled in the legend at the top). In Stroud's case, his standard deviation is relatively high (~1550 KTC) compared to those of other QBs we will examine soon. Finally, the solid red line (SMAVG (150)) represents the 150-day moving average, which smooths out the blue pricing line over roughly one football season.
Generally (and there are exceptions that we will discuss), we expect the blue line to move closer to the red dashed average line over time. That's what we're talking about when we say 'reversion to the mean.' For the 150-day moving average, what we want to pay attention to is the trend: is it going up, down, or flat? And then, where is the blue price line relative to the 150-day moving average: is it above, below, or crossing through? All of the answers to these questions indicate the direction in which the player's price may be headed.
Let's walk through a technical Analysis for CJ Stroud. Stroud's price takes off in the 2023 season, with the solid blue line moving up to the KTC higher bound of 10000 KTC. It took a while for the 150-day moving average to catch up, but it made its way up, and then through the offseason, you saw the solid blue line cross through the solid red line (a warning signal) and the start of a bullish-to-bearish reversal. The solid blue line checked back up to the moving average a couple of times, but really, there was little hope, and it crossed through the average line and then bottomed out close to the minus one standard deviation line (bottom blue dashed line). The moving average line is undergoing a bottoming process, which typically takes time. If Stroud's KTC stays above the minus one standard deviation line, goes through the bottoming-out process, and the solid blue line crosses upward through the solid red line, we'd say Stroud's price is probably headed to his two-year average KTC, ~8000 KTC. If Stroud's KTC falls below the minus one standard deviation line, more analysis will be needed. From a buying perspective, you should wait until the solid blue line crosses through (visibly) the solid red line. We say visibly, meaning it doesn't just check to the line and then bounce back, but you can see it move over the line, and there is space between the two lines.
Now, it's hard to believe we gleaned all of that just by looking at a player's chart, and we didn't consider any of the fundamentals. That's why some people in the investing world refer to technical analysis as funny-mentals. It is essential to consider the whole picture. Merry the fundamentals with valuation and then pair that with technicals to help with timing.
QB Chartbook
Dear Readers,
We’re an independent site thriving thanks to the support of our valued members. By signing up for our Substack or Patreon, you’re directly contributing to keeping our business running. Subscribing to Patreon grants you access to Substack content and all of our exclusive material. Your support is crucial, and we sincerely appreciate your commitment.
Thank you for helping us continue our work.
Now, we will examine the charts of all quarterbacks with a KTC greater than 3000 (excluding rookies, as we don't have sufficient data).
